Pages

Wednesday, November 19, 2014

How to: Show Line Number in SQL Server Management Studio

Have you ever met the following scenarios: 1) when you write a very complex ad-hoc query in SQL Server Management Studio (SSMS), you need to count the total columns that have been derived. 2) You even need to refer to the line that appears in the error message. If yes, you need to enable the option of showing line numbers in SSMS. In fact it is very simple. It can be done in a minute. You just need to know to click the right button. Be cautious that it is different for SQL Server 2008 (2008R2) and SQL Server 2012.

Solution

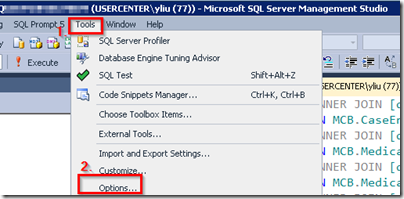
Step 1: In SSMS, select Tools tab then Options as shown below

showLineNumber0

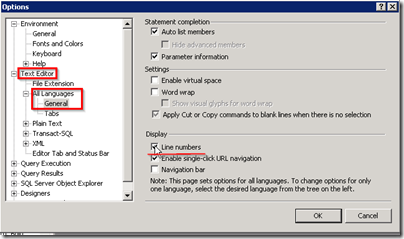
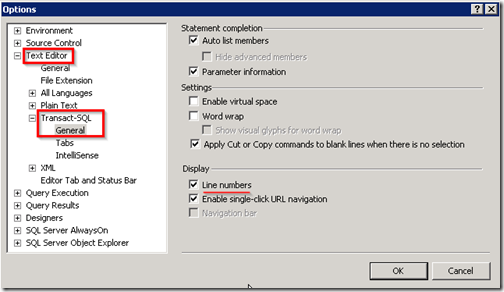
Step 2: In Option Popup Windows, expand “Text Editor

a. For SQL Server 2008 and SQL Server 2008R2, you need to choose “All Languages”. Under General page, check the box for Line Number.

showLineNumber2008R2

b. For SQL Server 2012, you need to choose “Transact-SQL”. Under General page, check the box for Line Number.

showLineNumber

Hope this tip will help you improve your coding efficiency. If you just want to jump to some specific line in SSMS quickly, you can use CTRL+G hot key.

Monday, June 30, 2014

Difference Between COALESCE and ISNULL

ISNULL is a T-SQL function to replace NULL values as COALESCE does. At some cases these two functions get the same results but there are some differences. Below is a summary of their differences and I hope that it will help you decide which function to use when you need to determine the one with better performance or better concurrency control.


COALESCE ISNULL
Standard ANSI SQL? Yes No (Only for T-SQL)
Numbers of Parameters Two or more parameters. Two parameters only.
Data type determination of the resulting expression Determined by the data type of parameters with the highest precedence Determined by data type of the first parameter
Allow both inputs to be untyped NULLs?
No. For SELECT COALESCE(NULL, NULL); , it will return an error. You need to have at least one of the null values be a typed NULL. 

SELECT COALESCE(CAST(NULL AS INT), NULL);

Yes. For SELECT ISNULL(NULL, NULL); it will return a NULL typed as an integer.
NULLability of the resulting expression Considered to be NULL with non-null parameters. Always considered NOT NULLable
Working with subquery as input parameters When executing COALESCE((subquery), 1), the subquery is evaluated twice.  you can get different results depending on the isolation level of the query. Evaluated only once.

Monday, June 16, 2014

How to: Create Hierarchies in PowerPivot for Excel 2013

Just like hierarchies in SSAS, hierarchies in PowerPivot for Excel 2013 provides a very convenient way to let you group data through different layers. Today we will use date dimension to demonstrate how to create hierarchies in PowerPivot.

First of all, you need to be in the Diagram View of the PowerPivot Window. Click Diagram View button under Home Tab.

diagramView

Create Hierarchies

Select the table you would like to build hierarchies in. Here we choose DimDate table. Then click the “Create Hierarchies” button on the upper right corner of the table. After renaming the hierarchy you can drag the fields from the table down to the hierarchy that was just created. An alternative is to select a column first and then right click the column > Create Hierarchies.

CreateHierarchy

Add Hierarchies

Right click the column that you would like to add to a hierarchy. A column can only be in one hierarchy. If a column already exists in a hierarchy, there won’t have an option to “Add to Hierarchy”.

addHierarchy

If you would like to add a column from another table, you need to use RELATED DAX function to add columns from one table to another table. Before you can add columns, you must create a relationship between these tables.

Adjust Hierarchy Levels

If you would like to adjust the levels between hierarchies, right click any one and move up or down, or remove.

adjustHierarchy

After hierarchies are created, you can directly drag it to PivotTable Fields just as columns.

HierarchyInPivot

Monday, June 2, 2014

How to: Enable PowerPivot Add-ins for Excel 2013

Power Pivot in Microsoft Excel 2013 is a build-in add-in you can use to perform powerful data manipulation and analysis in Excel 2013. However, it is hidden somewhere and you have to enable it first before using it.

Here are steps to dig it out:

  1. Go to File > Options > Add-Ins.

    Step1Option

  2. Change In the Manage box, click COM Add-ins from the drop down list and click Go. Note that the default is Excel Add-ins.

    Step2Addin

  3. Check Microsoft Office Power Pivot in Microsoft Excel 2013 box > OK. You can check Power View and Power Query in similar way as you can see they are also listed in the COM Add-ins list.

    Step3Check

  4. Bingo! You are ready to use Power Pivot for Excel 2013! PowerPivot tab should appear in your ribbon as shown below: 

    Step4Result

Friday, May 30, 2014

How to: Extract only Date Part From DateTime

It is common practice to extract only date part from datetime format, such as for a datetime of 2014-05-30 15:31:58.860, only 2014-05-30 is returned. Today we will show three main methods to choose from.

Method 1:

SELECT convert(DATE, GETDATE() )

Method 2:


SELECT CONVERT(VARCHAR(10),GETDATE(),126)

Method 3:


SELECT DATEADD(D, 0, DATEDIFF(D, 0, GETDATE()))

will mask the time part as 00:00:00.000.  It sometimes is regarded as better performance here.

Tuesday, March 18, 2014

SSIS's BULK insert error msg

Problem

When you are trying Bulk insert from csv file, here is the error message you may run into:

“Could not bulk insert because file 'C:csv_filename.txt' could not be opened. Operating system error code 3(The system cannot find the path specified.).”

Solution

First of all, confirm that you are specifying the UNC (Universal Naming Convention) path and not just drive letters. If you are trying to create the file to a remote location then the path should follow UNC, i.e:

             \\Server_Name or IP_ADDRESS\Shared_Folder_PATH(Name)\FILE_NAME

Note that the path may be OK if you are trying to create the file on the SAME server running SQL Server.

Secondly, make sure that the SQL Server service account has permissions to SQL Server instance.
For doing this you can use a Domain user or, create a new local user and start the services with that account.
Go to the lower left corner of the desktop, click START, input “services.msc”, then choose “SQL Server” as shown below:

bulkInsertService
Check Log On AS, a new window will pop up.

bulkInsertServiceLogon
The default setting is Local System account. Try changing it with a domain user account and restart SQL Server Service after new changes.

Last but not least, make sure that this account has Read and Write permissions on the folder where you are creating the file. To do so, right click on the folder --> sharing and security --> permissions.

That’s it! Now the error message should have been swept away.

Sunday, March 16, 2014

SSAS error msg: Unable to retrieve data mining algorithms

Problem

When you tried to create a new mining structure in SSAS, you may notice a warning message appears in the window as shown below:

ErrorMsgSetup_thumb1

Unable to retrieve a list of supported data mining algorithms. Make sure you are connected to the correct Analysis Services server instance and the Analysis Services server named localhost is running and configured properly. You can continue with a default list of data mining algorithms.”

Solution:

Step 1: Check Analysis Service has been started from SQL Server Configuration Manager.

SSAS_serviceStarted_thumb2

Step 2: Check the deployment property to make sure that it has been set up correctly.

SSAS_deployServer_thumb2

Friday, March 14, 2014

Snowflake Schemas Vs. Star Schemas

Today we will briefly discuss the difference between star and snowflake schemas, and what you should consider when you make decisions for a data warehouse design.

What are star schemas and snowflake schemas?

In dimensional data warehousing, star schemas represent a dimensional model which is composed of a central fact table and multiple “de-nomalized” dimension tables around the fact table. The hierarchy dimension are flattened into a single table. For example, in the sample data warehouse of AdventureWorks, the customer dimension may contain attributes about customers such as title, name, date of birth, address in one table. Or for a data warehouse in healthcare, the provider dimension would contain attributes about providers and also practices that providers belong to. Thus, there are some redundancy for star schemas.

On the other hand, a snowflake schema can be regarded as a special type of a star schema. It contains a central fact table and multiple normalized tables to represent one dimension. For example, the Customer dimension can be represented by Customer table and Geography table as shown below.

snowFlake2

In the example of the provider dimension, it may have one Practice table containing all practices’ attributes and another table contains only providers’ attributes and a foreign key pointing to the Practice table.

Differences or trade-offs

In terms of disk space, star schemas cost more space because snowflake schemas contain more normalized dimension tables, and thus removes some of the attribute redundancy in dimension tables. (But compared to the size of fact tables, the dimension tables usually are negligible.)

However, in terms of performance, star schemas usually give better performance in most cases because if a query in snowflake schemas may need many joins to do a data aggregation.

Also, a dimension table in snowflake schema may have one or more parent tables. So the dimensions in a snowflake schema must be highly controlled and managed to avoid update and insert anomalies.

Thus, Kimball design tips recommended star schemas in regards of understandability and performance. Even when using snowflake schemas, views are suggested to be placed on top of the dimensions so that they appear to the user as a single dimension.

Cases to choose snowflake schemas

There are some user cases that snowflake schemas may be a better choices:

  • Based on query frequency: Large customer dimensions such as Amazon or Facebook, where, for example, 90 percent of the fact table measurements involve anonymous visitors about whom you collect little detail, and 10 percent involve reliably registered customers about whom you collect much detailed data by tracking many dimensions. Moving the 10 percent registered customers as a separate dimension can improve performance.
  • Sparsely populated attributes, where most dimension records are NULL, are moved to a sub-dimension.
  • Low cardinality attributes that are queried independently. For example, a product dimension may contain thousands of products, but only a handful of product types.  So if the product types are often queried independently, it is better to have a separate product type dimension. Another example could be the provider dimension may contain a very large number of demographic attributes at the practice level. Rather than repeat a large number of attributes in the provider dimension, we might create a special type of normalized practice dimension called a “dimension outrigger” where the attributes are stored in the provider dimension.
  • Attributes that are part of a hierarchy and are queried independently. Examples include the year, quarter, and month attributes of a date hierarchy; and multiple enterprise calendar dimensions.

In summary, before making decision on which schema to use, you should have business requirements defined about how this data warehouse is used. You should reflect how users want to aggregate and “slice and dice” historical fact table data. You must embrace the goal of enhancing business value as its primary purpose. Work closely with business users, uncover the needs of your business users, then design a system that meet their needs!

Wednesday, February 26, 2014

2014 Gartner Magic Quadrant Reports for BI and Analytics Platform: leaders & trends

2014 Gartner magic quadrant report for business intelligence and analytics platform was released last week.  The report rates the strengths and weaknesses of 27 vendors in the market according to 17 defined capabilities across three categories: information delivery, analysis and integration.  Below is a snapshot of vendors’ performance charted on a graphical quadrant.


gartner-mq-2014

Who are leaders?

The two main axis remain the same as in 2013 report: completeness of vision and ability to execute. It added some capabilities such as Geospatial and location intelligence, Embedded advanced analytics, Business user data mashup and modeling, Embeddable analytics, and Support for big data sources. Tableau leads in ability to execute and IBM/SAS lead in completeness of vision. QlikView, Microsoft, SAP, Tibco, Oracle, MicroStrategy remain in leader quadrant.

What are the trends for 2014?

The answer is “business-user-driven data discovery and analysis” and “Cloud BI”. “The BI and analytics platform market is in the middle of an accelerated transformation from BI systems used primarily for measurement and reporting to those that also support analysis, prediction, forecasting and optimization”, according to Gartner's 2014 reports.The data-discovery category was pioneered by Tableau, Qlikview, Microsoft, IBM and SAS, which have done a better job than the others of integrating their enterprise and new data discovery capabilities.

I highly recommend you to read more detailed analysis of report here or download it from http://www.qlik.com/mq2014.

Monday, February 24, 2014

How to: Do Incremental Loading by Hashbytes Function with Stored Proc

Using hash functions in sql server for incremental data loading has a big performance advantage when you have millions of rows to load, or have several dozens of columns to compare and make decision on whether to update, insert, or expire, as mentioned by Andy Leonard's Anatomy of an Incremental Load. Brett Flippin has introduced the way to calculate hash columns with SSIS’s Script Components in his article Speeding Up Incremental ETL Processes in SSIS by Using MD5 Hashes. Today I would like to demonstrate how to calculate hash columns by stored procedures. This stored procedure will automatically concatenate all columns except hash columns for given tables, and then generate a hashKey for each row. What you need to provide is the name of the table. So it saves the time and efforts to drag and draw columns for tables with different structures.

First let's start with the script to create our test database and destination table:

-- Create test database
use master
go
if exists(select name from sys.databases where name = 'DemoSQL2012')
drop database DemoSQL2012
go
create database DemoSQL2012
go
-- Create Contact Destination table
use DemoSQL2012
go
if exists(select name from sys.tables where name = 'hashTest')
drop table dbo.hashTest
go

CREATE TABLE [dbo].[hashTest](
[personId] [int] IDENTITY(1,1) NOT NULL,
[firstName] [varchar](10) NULL,
[lastName] [varchar](10) NULL,
[hashKey] [varbinary](256) NULL,
CONSTRAINT [PK_hashtest] PRIMARY KEY CLUSTERED
(
[personId] ASC
))

Insert INTO [dbo].[hashTest] ([firstName], LastName)
VALUES ('David', 'Smith'),
('Bob', 'Stones')

If you check the table dbo.hashTest, you will see that it has four columns and two records, with hashKey column set as NULL.


hashtableStart


Create Stored Proc dbo.GetHashKey


Then you need to run the following script to create stored proc to generate hashKey.

USE [DemoSQL2012]
GO

CREATE PROCEDURE [dbo].[GetHashKey] ( @pSchemaName sysname,@pTableName sysname,@pDebug INT = NULL )
/************************************************************************************************************
Description: Populates hashKey column of target table indicated by @pTableName parm, using SHA1 algorithm.
Here the hashkey column is called hashKey.
The concatenated string as inputs for Hashbytes function is in a format of col1$col2$col3.
Examples: exec [dbo].[GetHashKey] 'dbo','hashTest', 1 to get the concatenated string to be calculated by Hashbytes fcn.
exec [dbo].[GetHashKey] 'dbo','hashTest', 2 to get the sql to update hashKey columns.
*************************************************************************************************************/
AS

BEGIN
SET NOCOUNT ON
DECLARE @SchemaName VARCHAR(MAX)
DECLARE @TableName VARCHAR(MAX)
DECLARE @HashSql VARCHAR(MAX)
DECLARE @Sql VARCHAR(MAX) = ''
DECLARE @CRLF char(2) = CHAR(13)+CHAR(10)

SET @SchemaName = @pSchemaName
SET @TableName = @pTableName

--- Concatenate strings for Hashbyte functions by INFORMATION_SCHEMA
SELECT @HashSql = COALESCE(@HashSql + '+ ', '')
+ 'ISNULL(CAST('+ QUOTENAME(COLUMN_NAME)+' as varchar),''~'')+''$'''+@CRLF
FROM INFORMATION_SCHEMA.COLUMNS
WHERE TABLE_NAME = @TableName
AND TABLE_SCHEMA = @SchemaName
AND column_name NOT LIKE 'hash%'


SET @sql = @sql + 'DECLARE @updateChunk int = 4000000;
WHILE 1=1
BEGIN
'

SET @sql = @sql + 'UPDATE Top(@updateChunk) '+ @SchemaName + '.' + @TableName + ' ' + @CRLF

SET @sql = @sql + 'SET hashKey = ' + @CRLF
SET @sql = @sql + 'HashBytes(''SHA1'','+ @HashSql + ')'+@CRLF

SET @sql = @sql + 'WHERE hashKey is null;
IF @@RowCount=0
BREAK;
END'

IF (@pDebug = 1)
BEGIN
DECLARE @sqlStr2Hash VARCHAR(MAX) = 'SELECT ' + @HashSql + ' as hashCol FROM ' + @SchemaName+'.' + @TableName;
EXEC (@sqlStr2Hash)
END
ELSE
BEGIN
IF (@pDebug = 2)
SELECT @sql;
ELSE
EXEC (@sql);
END

END

GO

Here we use SHA1 algorithms to be Hashbyte functions. According to the article “Exploring Hash Functions in SQL Server”, SHA1 is one of the reliable algorithms with “best spread over the hash space”. We use metadata INFORMATION_SCHEMA.COLUMNS to obtain all columns with given table names.


How to use Stored Proc dbo.GetHashKey?


To call this stored procedure we would execute it as follows:

exec [dbo].[GetHashKey] 'dbo','hashTest', 1

It will show you the concatenated string for each row.


hashString


If you call stored procedure with @pDebug set as 2, you will get the sql scripts to update the hashKey column.

exec [dbo].[GetHashKey] 'dbo','hashTest', 2

hashSql


If you want to update the hashKey column, call the stored procedure as follows:

exec [dbo].[GetHashKey] 'dbo','hashTest'

Now you can see the table is updated with hashKey:


hashColUpdated


If you would like to use this stored proc in SSIS packages, you can directly use Execute SQL Task with schema name and table name passed by as parameters.


Wrap up


You can directly call the above stored procedure to speed up calculation of hashKey columns for different tables when loading to data warehouse. The inputs are mainly the schema name and table name. With pDebug parameters, it would be easy to debug your hash strings or sql scripts.

Also please keep in mind that the hashbyte functions do have an input limit of 8000 bytes. For those extremely fat tables, you can lean on SQL Server's CLR integration and perform the hashing in a .NET assembly.
Reference: HASHBYTES (Transact-SQL)

Monday, February 17, 2014

Conversion between SSIS Integers and SQL Server Strings

When you carry out database migration, one of main headaches is the conversion of different data types between sources and destinations. If you are using SSIS, be careful about the conversion between strings and int. Sometimes SSIS will fail because the integer type defined is not big enough to hold the original data. It is also known as overflow problem. So here is a summary that indicates which kind of integer data types you should use for SSIS for strings in the source table. Hope it helps!

SSIS SQL Server Range Maximum String Converted
DT_I1 tinyint 0 to 255 varchar(2)
DT_I2 smallint -2^15 (-32,768) to 2^15-1 (32,767) varchar(4)
DT_I4 int -2^31 (-2,147,483,648) to 2^31-1 (2,147,483,647) varchar(9)
DT_I8 bigint -2^63 (-9,223,372,036,854,775,808) to 2^63-1 (9,223,372,036,854,775,807) varchar(18)
Note that for an empty string, you can use derived column task in SSIS with expression below to convert an empty string into a NULL integer in SSIS.
LEN(strCol) == 0 ? NULL(DT_I4) : (DT_I4)(RTRIM(strCol))

You can also refer to BOL: int, bigint, smallint, and tinyint (Transact-SQL)

Monday, February 10, 2014

Intro of Data Analysis in Healthcare for Triple Aim

Have you ever heard of Triple Aim in healthcare? If not, you may notice that private and public entities around the world are investigating how to maximize the power of analytics to improve quality of care, operational efficiencies, billing reimbursements with a lower cost. United States spent about 17.9% of GDP on healthcare in 2011, according to World Health Organization’s report.

With such a great opportunity, millions and millions of healthcare data are waiting for analysts to be turned into useful insights and predictions for Triple Aim. This presentation paints a big picture of what you can do with these huge volume and complicated data. What can be turned into reports, predictions, and actions? Analysis of enrollment and emergency department (ED) visits demonstrate the aspects you can dig into.

Moreover, what is the structure for claims? How to use quality measures? You may get a peek from an example of ED visits about how to dig out ED visits from claims.

Lastly, it explains common medical billing and coding, including ICD, CPT, and HCPCS to help you get a good grasp of these coding standards.

Saturday, February 8, 2014

Recordings for 24 Hours of PASS: Business Analytics - 2014

If you would like to take a peek about the coming PASS Business Analyics Conference in San Jose, CA, May 7-9, 2014;

If you would like to learn more about how to use Power Query, PowerPivot, Power View, and Power Map to discover and demonstrate business insights;

If you would like to learn something about big data or predictive analysis/modeling;

here is a valuable resource that you should not miss,

Recordings for 24 Hours of PASS: Business Analytics - 2014

Thursday, February 6, 2014

Hidden Gem for Data Analysis: Data Profiling Task

Data analysis and cleansing are the most time consuming parts when you want to load source data, or prepare sampling data for data mining. You can write TSQL to find out distinct values or lengths of a column that are existing in the testing data. However, when you have millions of rows or more than thirty columns for analysis, TSQL scripts might take a whole day to get the answer. Since SQL Server 2008,  SSIS has Data Profiling task that can conveniently help analyze the content and structure of data, and uncover patterns, inconsistencies, anomalies and even redundancies. Today we will give a brief demonstration about this hidden gem for data analysis.

How to view the result by Data Profiler Viewer?

Data Profiler Viewer is used to view the generated profiler by data profiling task in SSIS. You create a new package and drag “Data Profiling Task” to the control flow pane as shown.

dataProfilerTask2012

Double click the task, a new Data Profiling Task Editor window pops up and then click “Open Profile Viewer” button.

dataProfilerTask2012_openViewer

Click the open button at the upper left corner and locate the output profile file in xml format.

dataProfilerTask2012_openFile

Types of profiles and statistics for analysis

Then you can explore the profile. Below only show four kinds of profiler but you can have eight kinds of profiles to request:

  1. Column Length Distribution
  2. Column Null Ratio
  3. Column Pattern
  4. Column Statistics including min, max, mean, standard deviation for each column.
  5. Column Value Distribution including values, counts, percentages.
  6. Functional Dependency: fully or partially dependent of other column to check redundancy.
  7. Candidate Key: check which column might be a good candidate for a primary key or business key.
  8. Value Inclusion: check whether all values in a column exists in another table. It can be dimensions or lookup table.

dataProfiler_item

Demo

Let us take a look at the Column Value Distribution Profile first. Click each column on the top pane and then the lower pane will display Value, Count, Percentage for that column. You can sort by value, counts, or percentage by clicking the dropdown arrow at the right side of item. For this column, you can easily tell the top three kinds of type codes are M, P, R.

DistinctValue

Note that it won’t be an exhausted list for all the values. Here is an example for drug code. It only listed three values in the lower pane but number of distinct values is 48720. So if the variation for column values is a lot but for some values, there are only a tiny percentage records, the profile won’t display those small percentage.

DistinctValue_list

In summary, data profiles generated by Data Profiling Task of SSIS is very convenient to help you understand data, find patterns, derive data rules, detect the outliners of columns for data cleansing. You can even perform data profiling to test the foreign key relationship. If you would like to find out how to set up each kinds of profile requests, Jamie Thomson’s series of SSIS: Data Profiling Task are an awesome reference.

Reference: TechNet’s Data Profile Viewer

Monday, February 3, 2014

How to: Use Check Constraints to Enforce Business Rules

As a developer, you may often find that it is essential to ensure data integrity before the data get into database. Otherwise, you will face a cleanup work or the situation of “trash in, trash out” afterwards. Today we will address how to enforce business rules by using check constraints on columns.

Here's an example of a Member table with name and phone number as columns. Let us check constraint on the phone number column. Constraint will suggest that phone numbers should follow the format of xxx-xxx-xxxx.

IF OBJECT_ID('[dbo].[Member]') IS NOT NULL
DROP TABLE [dbo].[Member]
CREATE TABLE [dbo].[Member](
MEMBERID INT IDENTITY NOT NULL,
[Name] varchar(25) NOT NULL,
[PhoneNumber] varchar(12) NULL
)
---- INSERT RECORDS
Insert INTO [dbo].[Member] Values
('Susan', '697-555-0142'),
('Kevin', '819-555-0175')

If you check the table, you can see it already has two records.

SELECT *
FROM [dbo].[Member]


Add a CHECK CONSTRAINT


Then we add a CHECK CONSTRAINT to help check the format of phone numbers.

ALTER TABLE [dbo].[Member]
ADD CONSTRAINT CK_Member_Phone
CHECK ([PhoneNumber] LIKE '[0-9][0-9][0-9]-[0-9][0-9][0-9]-[0-9][0-9][0-9][0-9]')
GO

If any of existing records in tables violate the constraint to be added, it will pop up messages like this:
Msg 547, Level 16, State 0, Line 1
The ALTER TABLE statement conflicted with the CHECK constraint “CK_Member_Phone”
. The conflict occurred in database "xxxx", table "dbo.Member", column 'PhoneNumber'.


Test a CHECK CONSTRAINT


Next, you can test the check constraint by trying to insert a record that has a phone number not following the format defined in the constraint CK_Member_Phone.

Insert INTO [dbo].[Member]    Values 
('Charles', '212-555-0187'),
('Chris', '612555-0100')

An error message will be returned like the following one:
Msg 547, Level 16, State 0, Line 1
The INSERT statement conflicted with the CHECK constraint "CK_Member_Phone". The conflict occurred in database "DemoSQL2012", table "dbo.Member", column 'PhoneNumber'.

The statement has been terminated.

Monday, January 27, 2014

Decipher SSIS Error Codes: -1071607685

When using SSIS as tools to loading files, you usually can get a very clear error message that indicates what is going wrong. You can tell which column is wrong from ErrorColumn and for which reason the column brought failure from “ErrorCode – Description”.

However, when loading a source file that is not formatted as expected, if you have got an error output with "No Status is available" as ErrorCode and “0” as ErrorColumn as shown below, what do you feel?

SSISerrorNoStatus

Do you feel like lost in darkness? Somewhat …

Here is my recent experience in helping out troubleshooting file loading problem. Since there is no clue, all I can do is to check all constraints on all columns for potential trouble-makers.

Finally, it turned out that the trouble-makers is one of the obsolete columns that used to be NOT NULL, but no more input at the current loading. The solution is easy. You need to allow that column to have NULL values.

During the research for the clue, I uncovered two helpful resources to decipher SSIS error codes: 

The header file dtsmsg.h is under the folder

C:\Program Files (x86)\Microsoft SQL Server\110\SDK\Include (for SQL Server 2012)

The two resources covered the five kinds of messages as shown. The online one is in table form and easier to follow, while the header file is more precise and detailed in technical terms.

So next time, hope you will feel more confident when you get SSIS error messages!

ErrorHeader_dtsmsg

Sunday, January 19, 2014

Tableau, Qlikview, or Power BI?

Nowadays, there are lots of excellent products for turning fast-paced digital information into easily understood images and insights. So the common questions are: Which BI tool should I choose? Which BI tool has the most promising future? While waiting for this year’s Magic Quadrant for Business Intelligence and Analytics Platform, I’d like to share with you with Jen Stirrup’s opinion from a user or customer respect.

In her article Business Intelligence Barista: Mixing your choice of BI Coffee with Tableau, Power BI or Qlikview?, Jen compared Tableau, Qlikview and Microsoft Partner PivotStream from business criteria, data visualization criteria, and technical criteria. The comparisons are very clearly delivered in three tables for each category. She gave her scores in Excellent, Good, Yes/No, Limited for these three BI tools. If you would like to find why she gave the related scores, don’t forget to read her comments at the far right column.

Jen included the following as business criteria: time to implement, scalability, enterprise ready, long-term viability, free online help, big data support, size of partner network. As for visualization criteria, she compared data interactivity, visual drilldown, offline viewer, dashboard support, web/mobile clients etc. (It seems that Tableau has a “wow” factor in terms of eye-catching interactive visualization.) Last but not least, she discussed technical criteria in aspect of data integration, OLAP cubes, data modeling, data mining/science, multi-dimensional, xVelocity support, PowerPivot suppot, API, etc.

At last, Jen concluded that “There is no wrong choice, if it is the right choice for your organization.” The key to make decision on BI tools is to find out user requirement or buyers’ needs. I can't agree more on that. We need to know what we really need and what are the priorities before we go shopping for solutions.

Although Jen mentioned Power BI solution was not included in the comparison since it is still in preview, she mentioned Power View and Power Map as comparing to the other products. I wish that she could include product functionality and learning curve for developers for these three products as well.

Further reading for more qualitative analysis of BI market: 2013 Gartner Magic Quadrant for BI.

Monday, January 13, 2014

Debugging a Script Component in SSIS

As we have discussed how to debug a script task in SSIS, some readers asked “how to debug a script component in SSIS”. Before I wrap up my own examples, I highly suggest reading these two excellent articles:

  1. Script Component Debugging in SSIS 2012

  2. Breakpoint does not work within SSIS Script Component

You will learn three main methods to monitor a script component:

  1. Display a modal message by using the MessageBox.Show.
  2. Raise events for informational messages, warnings, and errors.
  3. Log events or user-defined messages.

Also you will get an idea about the limitation of situations that you can debug a script component for current versions of SSIS. 

Friday, January 10, 2014

Debugging SSIS Script Tasks

SSIS Script tasks provide codes to implement customized functions that a built-in SSIS task cannot achieve directly. It is often necessary to debug through a Script task to ensure it works properly. You can set breakpoints for events such as OnPreExecute or OnPostExecute from ten break conditions as we discussed in Set Breakpoints for SSIS Debugging. Moreover, you can define stopping points in a script task through Microsoft Visual Studio Tools for Applications (VSTA).

Set a breakpoint in VSTA for a Script Task?

After you click “Edit Script” button in Script Task, a VSTA window will open.

Click the line you would like to set a breakpoint. Then right-click it and select Breakpoint –> Insert Breakpoint.

Below shows setting breakpoints in SQL Server 2008 R2.

SetBreakpointsScriptTask1

Now you have the breakpoint set right before Messagebox.Show(). This means that the execution should break immediately before the message box is popped up.

SetBreakpointsScriptTask2

SQL Server 2012

The way to set breakpoints in Script Tasks for SQL Server 2012 is similar as shown.

SetBreakpointsScriptTask-2012

Also, after clicking Insert Breakpoint, a popup window will let you to do more fine tunings for your breakpoint through locations of Line and Character.

SetBreakpointsScriptTask

Note that SQL Server 2012 has one additional option: Insert Tracepoint besides “Insert Breakpoint”.


How breakpoints work?

After you set up the breakpoint, you can close Script Task Editor window. Right Click the Script Task and then select Execute Task. You would expect a yellow arrow displayed at the breakpoint.

SetBreakpointsScriptTask2012p2

After you press F10 button, a message box pops up with the message “Hello World”. After you close the popup window, the VSTA window should appear like this.

SetBreakpointsScriptTask2012p3

Tweaks for SQL Server 2008

If you use SQL Server 2012, you are lucky to get the breakpoint hit as described above.

If you use SQL Server 2008, you need some tweaks to make breakpoints working as expected:

Step 1: Set SSIS runtime mode as 32 bit at PROJECT Level.

Step 2: Re-open Script Task Editor window and save it again. In this way, your script task code is set to be compiled as 32 bit.


Shortcut Keys for Debugging

You can use debugger shortcut keys to speed up debugging. SSIS Script tasks share the same set of shortcut keys for Visual Studio. Here is a list of some common shortcut keys.

Keys Functions
F5 Run the application.

F10

Step Over (Execute the next line of codes but not follow execution through any function calls).
F11 Step Into.
SHIFT+F11 Step Out.
CTRL+BREAK Stop execution (Break).

F9

Toggle breakpoints.

Now I hope that you have a solid understanding of how to debug script tasks in SSIS. Take time to play with it and you will find it save the day for you in troubleshooting. If you have any questions, please feel free to leave a comment.

Reference:

  1. Debug a Script by Setting Breakpoints in a Script Task and Script Component
  2. Debugger Shortcut Keys for Visual Studio

Wednesday, January 8, 2014

Best Practices for ETL Design #10: When to Truncate Tables

Truncating tables is a common practice when you need the table to be totally refreshed. In Microsoft SQL Server Integration Service, it is often implemented through “Execution SQL Task” at the very beginning of ETL packages. You may never think about it would sometimes give trouble. Here is some worst possible scenario:

Let us imagine the target table to be refreshed is a report that users may run at any minute. If we truncate the target table at the beginning. However, for some reasons, there is some problem to get the rest of ETL package to complete immediately. Or it takes more than five minutes ( or the time that the end users could bear with) to finish the ETL package and to load new data to the target table.

Then what will happen to users on the reporting side? They will come back to you and complain the report is down!

Solution

Therefore, in order to avoid the above worst scenario, in your ETL packages, please truncate the final key target table at the LAST minute when its new data is ready to load. Satisfy end users with your reports always on!

Thursday, January 2, 2014

Set Breakpoints for SSIS Debugging

Like debugging codes for other languages or tools, it is often necessary to set breakpoints to pause execution so you can examine variable values where you think the problem can be. SSIS provides a very straightforward GUI to help you set breakpoints in SSIS packages.

Where to set breakpoints?

You can set breakpoints on a task or a container. A task can be Execute SQL Task, data flow tasks, script tasks, etc. A container can be a For Loop container, a Foreach Loop container, or a Sequence container.

Moreover, there are eleven break conditions that you can choose from as shown below

SetBreakpointsForEachLoop-HitCountType

These break conditions are defined as:

  1. OnPreExecute: Called by a task or a container immediately before it runs.
  2. OnPostExecute: Called by a task or a container immediately after it runs.
  3. OnError: Called by a task or container when an error occurs.
  4. OnWarning: Called when the task is in a state that does not justify an error, but does warrant a warning.
  5. OnInformation: Called when the task is required to provide information.
  6. OnTaskFailed: Called by the task host when it fails.
  7. OnProgress: Called when there is measurable progress about task execution.
  8. OnQueryCancel: Called at any time in task processing when a cancel execution is fired.
  9. OnVariableValueChanged: Called when the value of a variable changes. The RaiseChangeEvent of the variable must be set to true to raise this event.
  10. OnCustomEvent: Called by a custom task-defined events.
  11. Loop iterations: Called when the iteration condition in a loop is satisfied. This only appears for a For Loop container and a Foreach Loop container.

Moreover, there are four Hit Count types you can define:

  • Always
  • Hit count equals
  • Hit count greater than or equal to
  • Hit count multiple

After you define a Hit Count Type, you can specify a Hit Count at which the breakpoint executes. This is especially useful when you want to skip some iterations and break at some specific iterations.

How to set breakpoints?

In SSIS designer, navigate to the control flow panel.  Right-click the object where you want to set the breakpoint and then click the Edit Breakpoints option. You will see a Set Breakpoints window popup just like the picture shown above.

Next, select break conditions you like to have. Here you can combine multiple break conditions. For example, you can let it break at both OnPreExecute and OnPostExecute events so that you can examine the changes on variables. The default Hit Count Type is grayed out when the related break condition is unchecked. Once a break condition is selected, you can go further to define Hit Count Type and Hit Count. Below is a breakpoint set at a loop when its loop iteration is equal or larger than 2.

SetBreakpointsForEachLoop-HitCount

After you close the Set Breakpoints window, you will notice a red dot appears on the object with breakpoints.

SetBreakpointsForEachLoopWithBreakpoints

Furthermore, setting breakpoints in SSIS Script tasks is a little different from the way shown above. If you would like to know more, please stayed tuned.

How to modify breakpoints?

You can modify the breakpoint in the same way you set breakpoints. Right-click the object and then click the Edit Breakpoints option.

Now you have a powerful tool to help your troubleshooting effectively. With breakpoints, you can step through your ETL package to keep track of your variables and status of packages.